| Gender | Age | count |
|---|---|---|
| Female | 24 | 610 |
| Female | 85 | 193 |
| Female | 21 | 435 |
| Female | 27 | 619 |
| Male | 30 | 621 |
| Female | 73 | 545 |
| Male | 63 | 577 |
| Female | 87 | 137 |
| Female | 67 | 643 |
| Female | 77 | 415 |
Last week Josh Simons resigned as MP for Makerfield, prompting a by-election in which Andy Burnham is expected to be the Labour candidate.
People (mostly journalists) want to characterise Makerfield politically.
One way of doing this is by reporting how “Leave” or “Remain” the constituency is. The 2016 membership plebiscite becomes less a referendum, and more a revenant, doomed to characterize constituencies until the end of time.
Because the referendum was counted by local authorities, we almost never know exactly how many people in Westminster constituencies voted to Leave and Remain. In 2016 I published estimates of how many people had voted to Leave and Remain in each constituency. You can find those estimates at Google Sheets. Those figures suggest that in Makerfield 65% of those voted voted to Leave.
Since 2016, a lot has happened. One thing that happened is that new boundaries for Westminster constituencies were introduced. I’ve produced estimates of the number of people who voted Leave and Remain in those areas. You can find them at Google Sheets. Because Makerfield (2024 edition) is very similar to Makerfield (2010-2024 edition), there’s not much difference. I estimate that 65.8% of those who voted in that area voted to Leave. In terms of people, that’s 35,020 Leave voters, and 18,150 Remain voters, rounding to the nearest ten.
These figures give the result of the referendum sliced up by different geographies. They are, I believe, the best guide as to how an area voted at a particular point in time. However, the further we get from time of the referendum, the stranger it is to see these figures cited. The statistic remains the same, but the place to which it refers changes. Most crudely, many people who voted in 2016 have since died. Since those who voted Leave tended to be older than those who voted Remain, this means that the current proportion of Leave voters is lower than it was in 2016. There might be good reasons for continuing to cite the 2016 figure – maybe it’s the most easily understood, or maybe there’s a strange contractual argument that we owe duties to all those who voted in the referendum, dead or alive. But it would be a poor guide to current behaviour even if no one had changed their opinion.
Prompted by a question on BlueSky from Tim Bale, I decided to work out how many Leave and Remain voters from 2016 are still around. This turns out to be a slightly awkward question to answer, and not just because the exercise itself is slightly crass. To answer the question, we’ll need information of three kinds:
- the age and gender distribution of the 2024 Makerfield constituency, as things stood at the time of the referendum
- some guide as to how age and gender affected how people voted in the 2016 referendum
- the age and gender distribution of deaths in Makerfield since 2016.
In what follows, I’ll describe how I put these sources of information together to estimate how many Leave and Remain voters have died since 2016. Everything I calculate assumes that there was no movement in or out of Makerfield. Accounting for flows of population between constituencies is not in my judgement possible given the data available.
Makerfield as it was then
We need to know the age distribution of the 2024 Makerfield constituency as it was in 2016. We can find the necessary data at Nomisweb. The query tool allows us to get the 2021-based small area estimates of population. Because the people at Nomisweb are wonderful, and foresee all eventualities, they make it possible to aggregate these small area estimates not just to the 2010-2024 boundaries that were in use at the time, but also to the 2024- boundaries which were not even a twinkle in the eye of the Boundary Commission.
This age distribution is available for men and women separately. Because I never want to download things manually, I’ve been greedy and downloaded information for all of the country, and only latterly filter this to Makerfield.
Here’s what a random selection of rows of that data look like.
Age and gender and referendum vote choice
We know the number of people of different ages and different genders in Makerfield in 2016, but no official source will tell us how these people voted (or indeed whether they voted). We must therefore learn from national data.
Here I’m going to build a model of referendum vote choice based on the post-referendum wave of the British Election Study. The model is a generalized additive model, which allows for a smooth relationship between age and voting behaviour, where that relationship is different for men and women.
With generalized additive models, the best way to understand the model is to plot it. So here are the predicted probabilities of voting Leave and not voting at all, by age and by gender.
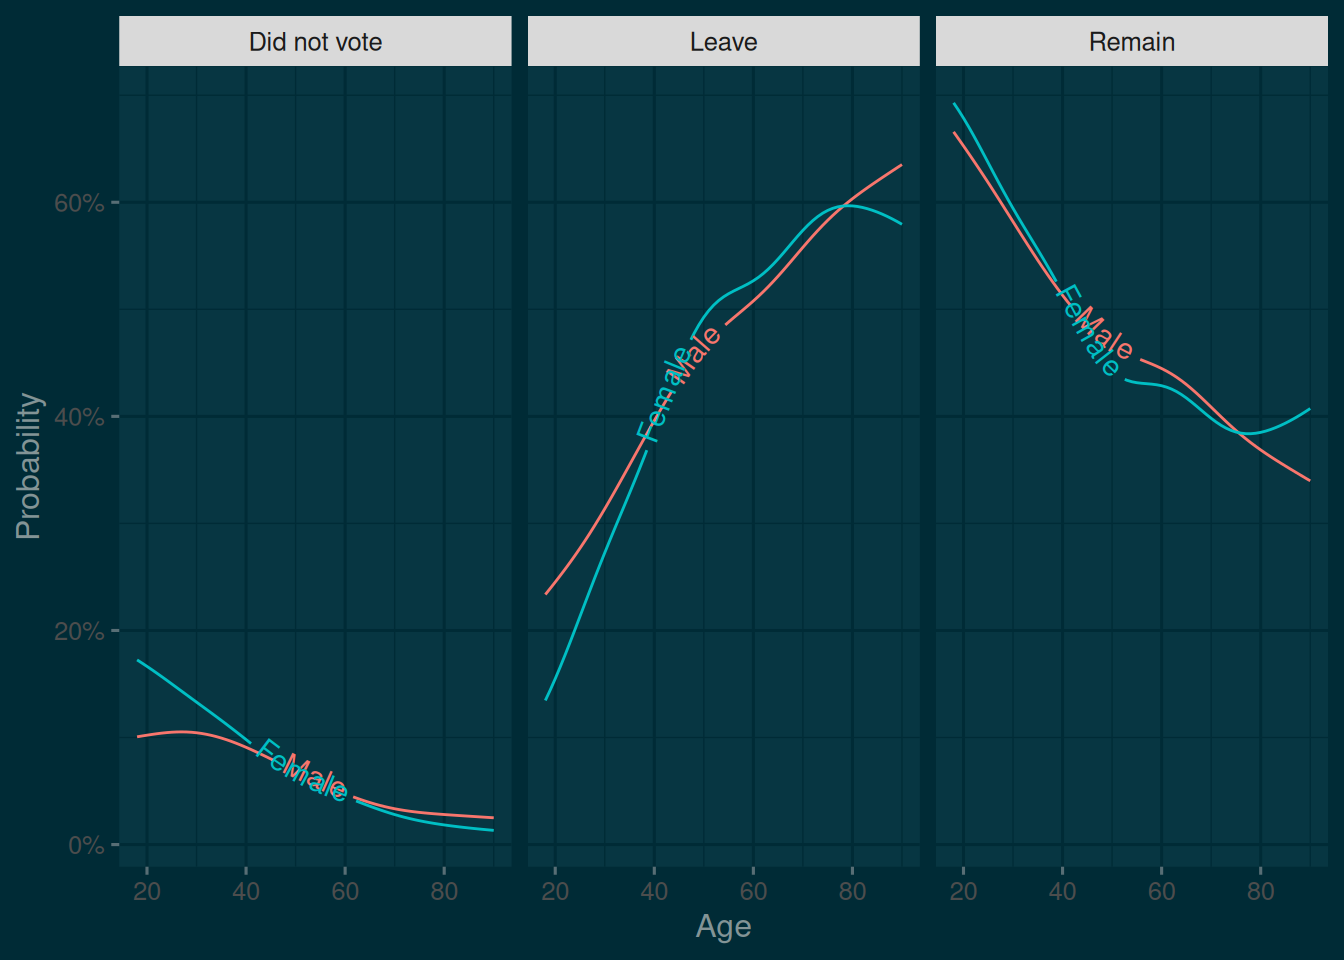
There are two problems with these model derived predictions. First, the proportion of people not voting is far too low. Although turnout in the EU referendum was high, it was still less than 75%. The predicted probability of not voting is always less than 25% for all ages and either gender.
Second, this model derived prediction doesn’t know anything about Makerfield, and any predictions we make for the voters in Makerfield won’t match to the results for Makerfield.
In order to make our predictions match know results, we’ll use a logit shift. The logit shift is one of those techniques in political science which is unreasonably effective. Instead of working on the probability scale, we turn those probabilities into “logits”. We then add on a little extra (or subtract a little extra), convert it back into a probability, and see what this does to the result. Here’s my code which will adjust our probabilities so that everything matches the results of the referendum .
We can now get the number of people in 2016 Makerfield, of different ages and genders, who voted for each option, or did not vote at all. Here is another random draw of rows from our data, with those counts now added.
| Gender | Age | Remain | Leave | DNV |
|---|---|---|---|---|
| Male | 69 | 161.81008 | 444.8409 | 144.34901 |
| Male | 40 | 133.58838 | 211.9879 | 253.42372 |
| Male | 67 | 141.60622 | 373.7457 | 131.64807 |
| Female | 82 | 54.01603 | 170.4479 | 25.53602 |
| Male | 65 | 140.55197 | 356.9899 | 137.45812 |
| Male | 55 | 158.24504 | 349.4100 | 214.34497 |
| Male | 45 | 181.30601 | 333.0447 | 319.64927 |
| Female | 27 | 145.09001 | 114.3505 | 359.55952 |
| Male | 41 | 152.86180 | 250.3816 | 286.75663 |
| Male | 79 | 56.11936 | 185.9735 | 45.90711 |
Introducing mortality
Given this information, we can now start introducing information on mortality. Once more, we return to NomisWeb, where we can find mortality statistics by sex and age by using the query tool (“Life events”). Working with this data is slightly awkward: unlike the figures for the age distribution, these figures are not baked into ready aggregates. We must download the data at a low level, and aggregate back up.
The data itself gives the count of deaths by age group, gender and geography. Here’s a random sample of rows, for lots of different constituencies, showing a large number of zero returns.
| Date | Gender | measure | geogcode | Age | value |
|---|---|---|---|---|---|
| 2023 | Female | Deaths | E02001908 | Aged 15-19 | 0 |
| 2017 | Female | Deaths | E02000180 | Aged 90 and over | 5 |
| 2021 | Male | Deaths | E02003844 | Aged 60-64 | 0 |
| 2018 | Female | Deaths | E02004392 | Aged 45-49 | 0 |
| 2021 | Female | Deaths | E02000843 | Aged 80-84 | 0 |
| 2021 | Female | Deaths | E02003344 | Aged 20-24 | 0 |
| 2023 | Female | Deaths | E02000520 | Aged 60-64 | 0 |
| 2022 | Female | Deaths | E02002686 | Aged 75-79 | 8 |
| 2017 | Male | Deaths | E02005406 | Aged 35-39 | 0 |
| 2021 | Female | Deaths | E02005210 | Aged 55-59 | 0 |
Unfortunately the data only includes mortality figures for 2017 to 2023. I have therefore had to assume that mortality in Makerfield in 2024 and 2025 was the same as mortality in 2023.
I can aggregate my predictions to the age ranges shown in the mortality data, adding up the numbers of Remain voters, the numbers of Leave voters, and so on. I can then proportionally allocate the deaths in each age-by-gender group, and working out how many voters of each type have died.
How many then?
Overall, I estimate that 6167 Leave voters might have died since 2016, compared to around 2003 Remain voters. That’s a mortality rate amongst Leave voters of 17% amongst Leave voters, compared to a rate of 11% amongst the (on average younger) group of Remain voters.
This means that amongst the still living in Makerfield, the Leave:Remain split moves from 66:34 to 64:36.
These are estimates. To the extent that they are wrong, they are likely to under-estimate the number of Leave voters who died, and over-estimate the number of Remain voters who died. Bad health was a significant individual- and aggregate-level predictor of voting for Leave, and that would affect mortality estimates. However, more sophisticated modelling, or including mortality for 2026 to date is unlikely to change significantly the qualitative conclusion.
Ultimately, these actuarial exercises don’t affect the main reason why continuing to cite these numbers feels odd, and that’s that some people have changed their mind since then.