Earlier today Paul Waugh from the Independent posted a tweet showing campaign material from the Green Party.
The leaflet showed a bar chart with estimates of support for the Conservative (44.8%), Labour (9.1%), and Green parties (43.4%) in the ward of Whinfield.
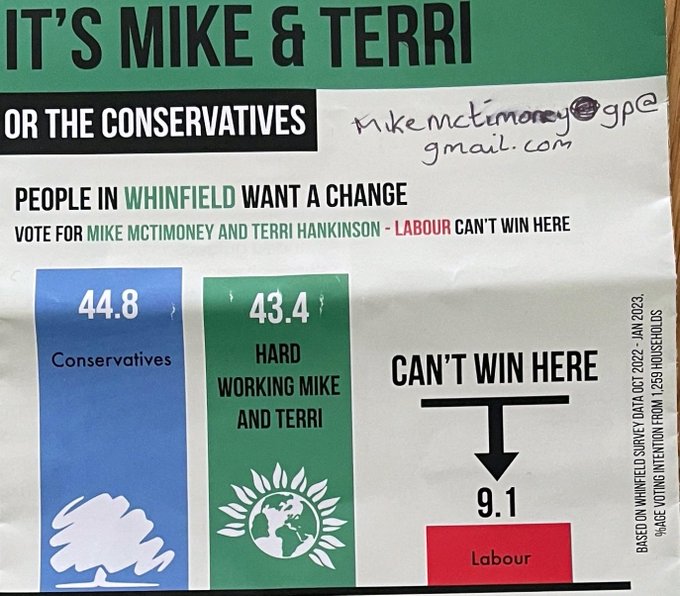
The leaflet claimed that Labour couldn’t win in Whinfield, and urged Labour voters to switch their vote to the Greens.
Other leaflets in Paul’s thread also showed bar charts with the Green Party in second place, although no other leaflet offered estimates of support to one decimal place.
These bar charts were, we are told, were based on “recent polling from residents throughout the area”.
Should we believe these estimates?
In principle, it’s possible to conduct polls at a very local level. Parties have access to the full electoral register, and therefore have information on the relevant “population”. It would be possible to conduct face to face polling, ask for a named person at each address, and ask them their vote intention.
Such a poll would, like any poll, have to deal with non-response. The people who are:
- are at home when you’re polling
- answer the door, and
- answer your questions
are not a random sample of the population.
You can deal with non-response by coming back multiple times at different hours of the day, but this is very costly and can’t be done quickly. Alternately you can “weight” different responses so that responses from categories of people who are less likely to respond are weighted up, and responses from categories of people who are only too happy to give you a piece of their mind are correspondingly weighted down.
To weight responses like this, you need to collect information on weighting variables (which might include age, sex, and highest educational qualifications), and you need information on the distribution of people for each of these weighting variables. This kind of information is now available (for England and Wales) through the most recent Census releases.
(This glosses over the difference between the resident adult population and the voting eligible population, which can be an issue. But this is a minor point in comparison to what has yet to come).
All of this assumes that people are responding sincerely to your questions about their vote intention, and respond to your questions about their demographic characteristics in the same way.
If you are reading this post and are at all familiar with British elections, you might already have spotted two problems:
- People don’t respond sincerely to questions from canvassers, and
- Canvassers don’t ask about demographic information.
It is much easier to tell a committed canvasser from Party X that you are still undecided than to tell them that you are voting for Party X’s mortal enemy.
It’s also fairly easy to refuse to answer demographic questions from a canvasser, although I have never heard of a canvasser asking this kind of question, so I am not sure what kind of reception they would get if they asked.
If people don’t respond sincerely, or if you don’t account for non-response biases by weighting or statistical modelling, you are not going to get a sensible answer.
This is true regardless of how otherwise sophisticated your efforts to analyse survey responses are. Mentioning Markov Chain Monte Carlo in vain will not help you.
It’s possible the poll in Whinfield will be right. Maybe Green party campaigners are extremely prescient, examined the marked register from 2019 knowing they would want to poll in 2023, and are weighting to turnout in the previous election. Or maybe they’re using information on Census output areas and letting canvassers guess gender and age. But this would place a great deal of weight on responses that are probably contamined by the fact that survey respondents know they’re talking to someone who has an interest in a particular answer.